Application of 3D Cell Explorer: Metrics and Tracking
Cell Tracking
On this page you can explore cell tracking as we see it: in 3‐D and stain‐free.
The 3D Cell Explorer allows for:
- Measuring Chemotaxis‐related migratory responses;
- Measuring effects of cytoskeletal abnormalities;
- Quantitative tracking of cells of interest.
Cell migration is essential for the proper development and maintenance of multicellular organisms. Tissue formation during embryonic development, wound healing and immune responses all require the coordinated movement of cells. Errors during this process can have serious consequences, including vascular disease, tumor formation and metastasis. An understanding of the mechanism by which cells migrate may lead to the development of novel therapeutic strategies for the well‐being of humankind.
The 3D Cell Explorer allows for real‐time and non‐invasive monitoring of cell migration in 3‐D. With the 3D Cell Explorer, one can measure chemotaxis‐related migratory responses, effects of cytoskeletal abnormalities on cell migration patterns, and perform quantitative tracking of cells of interest.
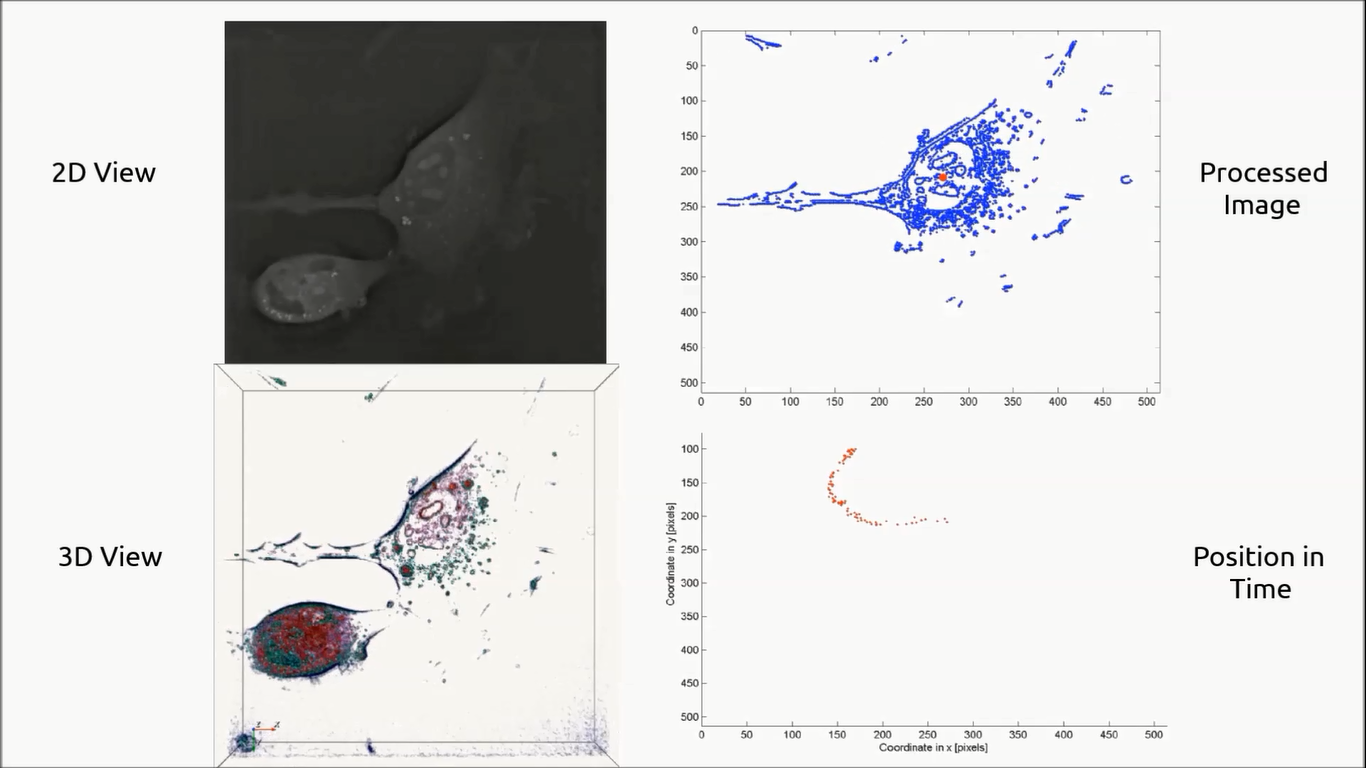
Quantitative Tracking of Cells of Interest
Migration of a Fibroblastic Reticular Cell (“FRC”) over time. Displayed on the left is the two‐dimensional Refractive Index map in grey‐scale on the top, and the 3‐D view on the bottom. In the top right is the 3‐D image after filtering out the background noise and the signal coming from the dead cell on the bottom of the field of view. In the bottom left, the location of the barycenter of the cell is followed over time, allowing for cell tracking.
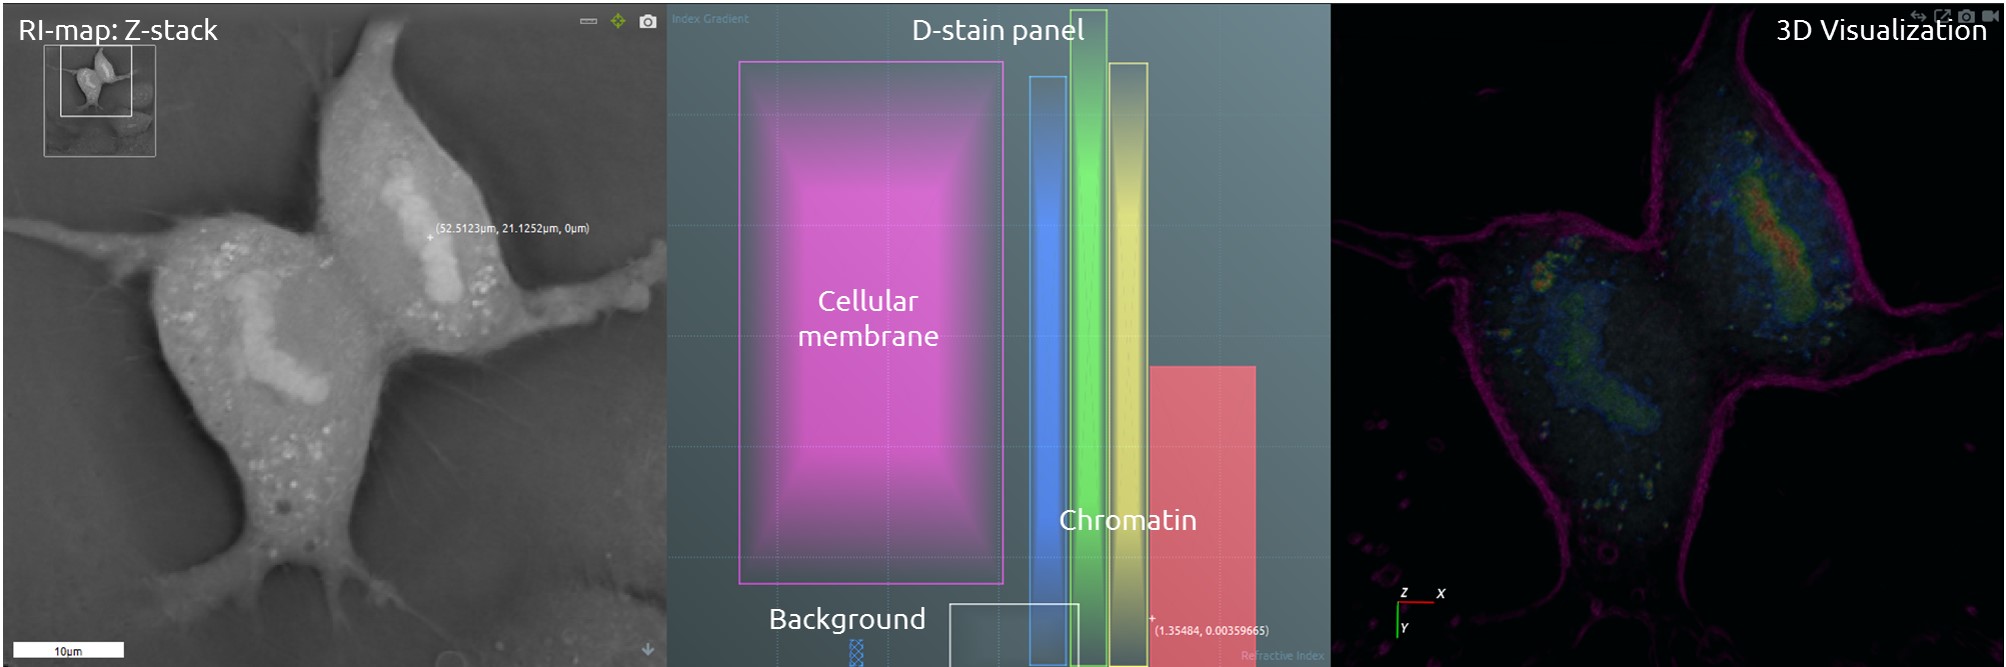
Refractive Index Segmentation (Digital Stains)
On this page you can explore analyzing data via Refractive Index Segmentation. STEVE software does this by applying a digital stain (“D‐stain”).
Nanolive’s technology allows the:
- Differentiation of sub‐cellular populations in co‐culture;
- Use of the Refractive Index (“RI”) of chromatin as a marker of each mitotic phase;
- Discrimination of different microorganism strains such as yeast and bacteria.
Segmentation of intact cells is a critical task in automated image analysis and quantification of cellular microscopic images. Automatic segmentation in 3‐D microscopy image sets is essential for many biological studies, including high‐throughput analysis of gene expression level, morphology, and phenotypes at single cell level.
STEVE’s digital staining panel allows one to distinguish different cell types and cellular components based only on their specific Refractive Index range. The D-stain remains robust and consistent across several acquisitions and during the whole real‐time acquisition, allowing an automatic segmentation of cellular populations.
Monitoring of Changes in DNA Refractive Index During Mitosis
Fibroblastic Reticular Cells (“FRC’s”) were grown to 60% confluency in complete DMEM medium (Dulbecco’s Modified Eagle Medium) in 35mm glass‐bottom culture dishes (FluoroDishes™ WPI, #FD35-100). The time‐lapse imaging experiment was conducted with a standard top‐stage incubator set to 37°C and 5% CO2 for 45 minutes, capturing images every 30 seconds.
The refractive index of the DNA changes during mitosis. The 3D Cell Explorer is able to distinguish between different mitotic phases based on these changes of chromatin refractive index.
Volume
On this page you can explore volume measurement as we see it: in 3‐D and stain‐free.
The 3D Cell Explorer allows for:
- Label‐free direct volume measurement of cell, of intracellular compartments, and of extracellular components;
- Quantitative monitoring of cellular mass growth;
- Detection and measurement of stress vacuoles in living cells.
Cell volume is a fundamental parameter in Biology and Medicine. Optical technology offers many possibilities for cytometry, but obtaining an accurate optical measurement of cell volume is still very challenging. Currently, the most common method is indirect measurement where the cell is submerged in a fluid‐filled container and the displaced volume is estimated.
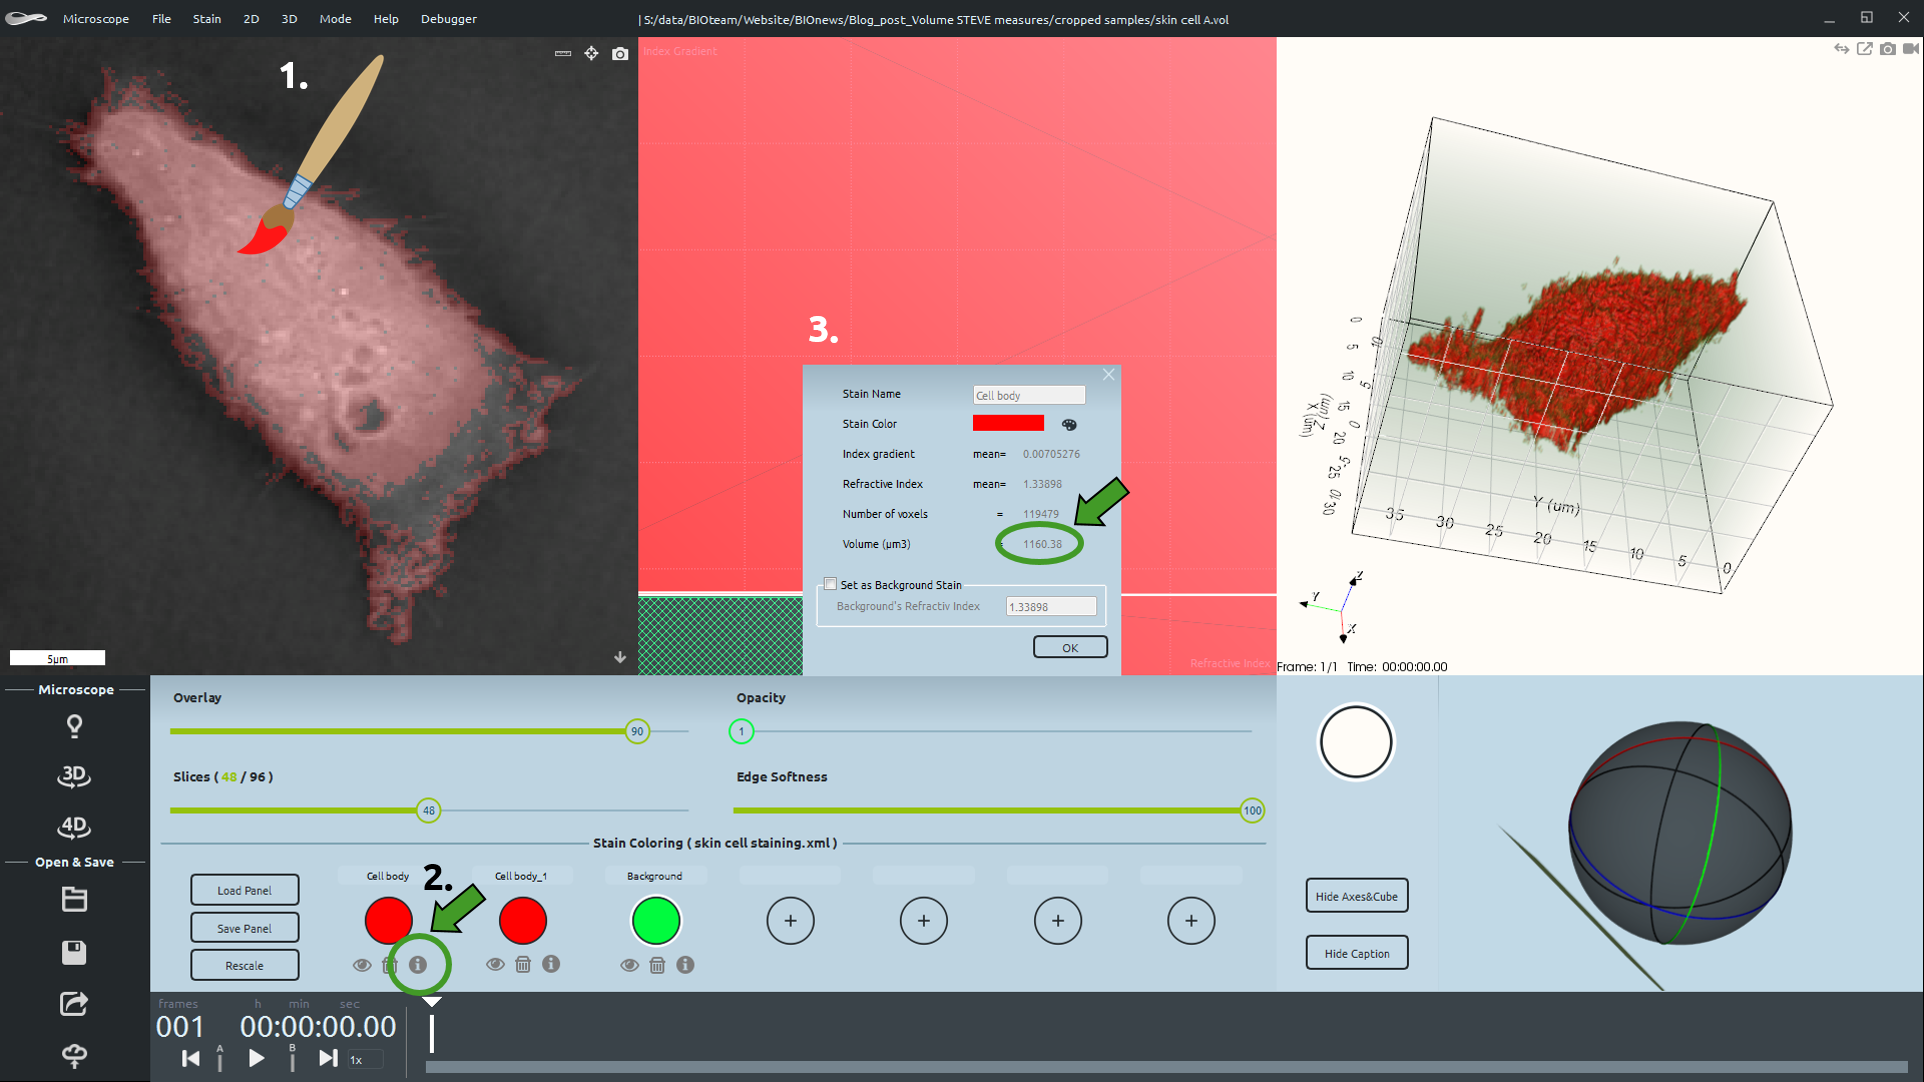
Nanolive’s 3D Cell Explorer goes beyond these limitations and allows for direct volume measurements of biological samples. With STEVE software you can monitor the cellular volume, in a precise and quantitative way, and in real‐time. Following the digital staining of the cell, the volume of the stain can be obtained with a simple click of the mouse.
Cellular Volume Measurement with STEVE
Human skin cancer cell were grown to 60% confluency in complete DMEM medium (Dulbecco’s Modified Eagle Medium) in 35mm glass‐bottom culture dishes (FluoroDishes™ WPI, #FD35-100) and fixed with 4% PFA for 15 minutes. The total cell volume was digitally stained in red with STEVE software, based on its range of Refractive Index (“RI”). The total cell volume was evaluated by means of the “Digital Volume” function of STEVE software.
Area
On this page you can explore measurement of surface area as we see it: in 3‐D and stain‐free.
The 3D Cell Explorer allows for:
- Evaluate in real‐time the available growing surface for cell culture;
- Measure the speed of cellular growth;
- Estimate the surface of a 3‐D hydrogel and matrix.
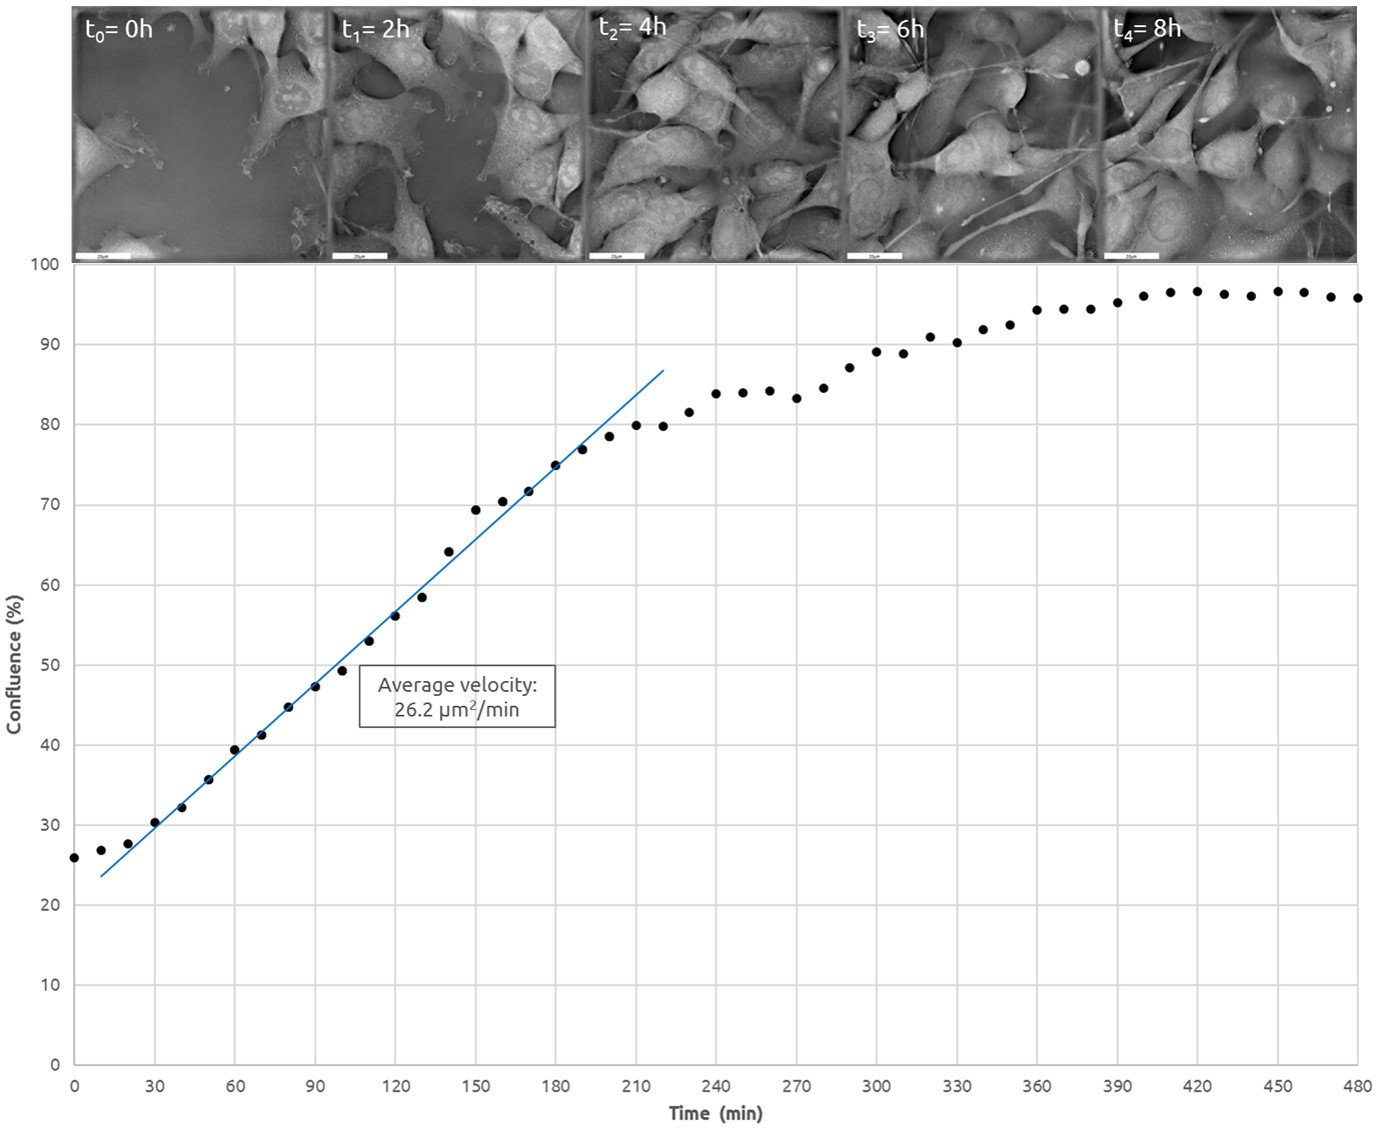
The most routine processes in cell culturing, such as passaging (process of sub‐culturing cells), induction of differentiation, or formulation of any repeatable experimental protocol requires that culture dish surface area covered by cells be carefully controlled and documented. Nanolive’s technology produces immediate results, giving a fast, accurate, and marker‐free measurement of surface area based on the specific Refractive Index (“RI”). By capturing images at the beginning and at regular time intervals during the real‐time acquisition, this approach provides an accurate way to monitor cell movement in 4‐D, and to quantify the rate of cell migration.
Monitoring of Surface Covered by Cancer Cells
Mouse skin cancer cells (B16, p30) were grown to 100% confluency in complete DMEM medium (Dulbecco’s Modified Eagle Medium) in 35mm glass‐bottom culture dishes (FluoroDishes™ WPI, #FD35-100). The time-lapse imaging experiment was conducted with a standard top-stage incubator set to 37°C and 5% CO2 for 12 hours, capturing images every 2 minutes.
Thickness
On this page you can explore thickness analysis as we see it: in 3‐D and stain‐free.
The 3D Cell Explorer allows for:
- Hydrogel thickness quality check measurement;
- Cellular thickness dynamic variations monitoring, in real‐time.
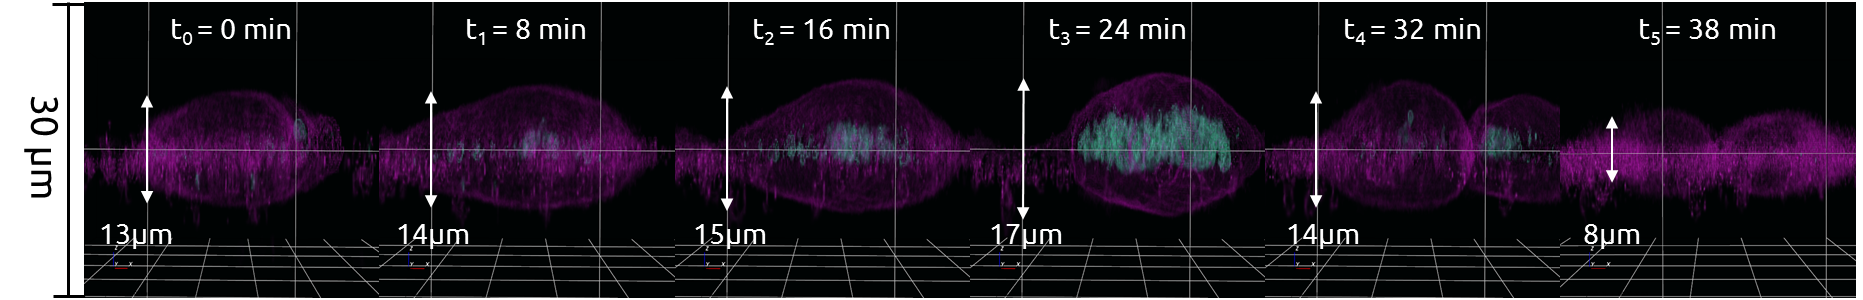
Cells change shape constantly as they move and divide, but the measurement of cell thickness is difficult. Most of the current microscopy techniques can measure the dimensions in the X‐ and Y‐axes very accurately but are unable to measure the cell in the Z‐axis. The 3D Cell Explorer allows you to measure the thickness of living cells in real‐time, without the use of markers.
Monitoring Cellular Thickness During Mitosis
Fibroblastic Reticular Cells (“FRC’s”) were grown to 60% confluency in complete DMEM medium (Dulbecco’s Modified Eagle Medium) in 35mm glass‐bottom culture dishes (FluoroDishes™ WPI, #FD35-100). The time‐lapse imaging experiment was conducted with a standard top‐stage incubator set to 37°C and 5% CO2 for 45 minutes, capturing images every 30 seconds.
Live HeLa Cells Infected with Chlamydia trachomatis
Living HeLa cells infected by Chlamydia trachomatis were imaged with the 3D Cell Explorer. The parasite inclusion bodies are displayed in green inside the cell cytoplasm.